
HAD SOME FUN DOING RESEARCH YESTERDAY. LOOK WHAT WE FOUND!
WHAT I WANT TO KNOW IS HOW MUCH OF THAT MONEY IS STOLEN OFF OF HUMANITY THROUGH TAXES, MAYBE THE USA JUST PRINTS MONEY OUT?
http://scienceogram.org/blog/2015/07/space-missions-cost-new-horizons/
The cost of space missions
This week, NASA’s New Horizons probe made the first ever flyby of distant, frozen Pluto. We were wondering how much the mission cost, how that stacked up against the price of other space exploration, and how that looked in context with other expenditure…in this case, the war in Iraq. We’ve produced an infographic to try to make sense of it all. Please share it!
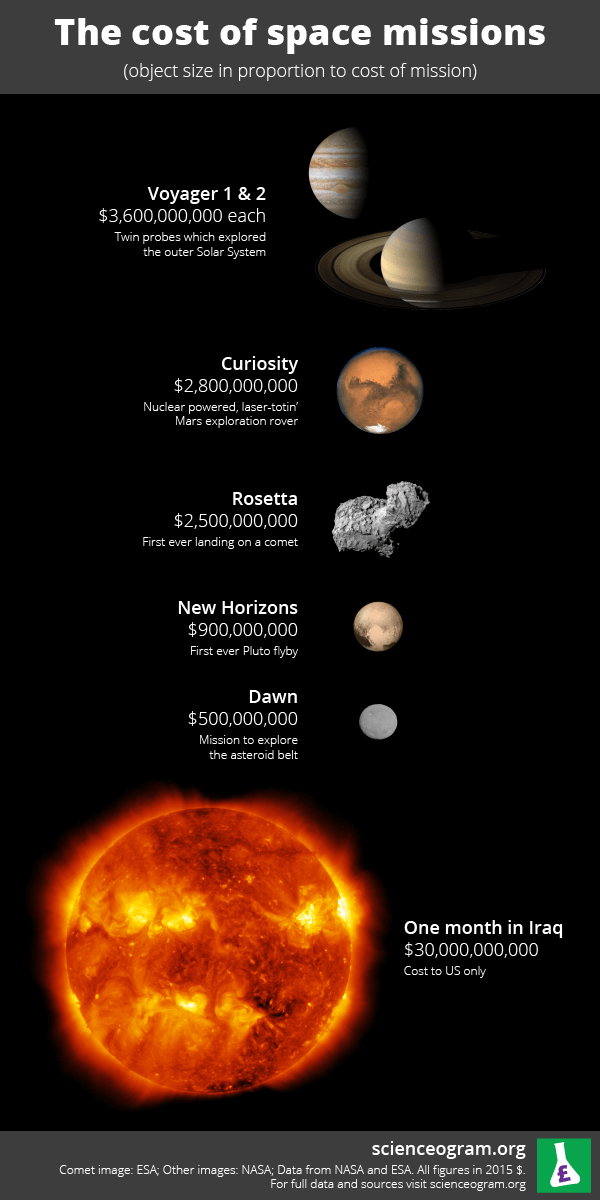
The basic take-home message here is that space exploration is cheap: an ambitious space mission might cost a couple of billion dollars, which is a few dollars per American, or euros per European. As our Rosetta infographic points out, it’s also important to remember that these costs are spread out over the duration of the mission, which is often a decade or more. That means exploring space costs literally cents per person per year, for which we get spectacular images, important science, and the ever-present possibility of spin-out technologies which can transform our everyday lives.
By comparison, the war in Iraq is estimated to have cost the US alone three trillion dollars. We had to divide that up into a per month cost just to get it to fit on the graphic, and even then it dwarfs the cost of space science. Sending New Horizons to Pluto cost less than an average day in Iraq.
Each of these missions is fascinating in its own right, so do read more about Voyager, Curiosity, Rosetta and Dawn. But of course the limelight at the moment is firmly on New Horizons as the first high-resolution images of Pluto’s mysterious surface trickle back to Earth. Massive congratulations to the team!
All the data we used in this infographic are available in a Google Spreadsheet.
******************************************************************************
FROM THE FIRST ORDER;
WHAT WE FIND DISGUSTING IS A PICTURE OF THE SUN AND IRAQ WAR? AS THE USA NASA IS EXPLAINING HOW MUCH THE WAR COST IN IRAQ BY USA PAYING FOR IT AT A COST OF 3 TRILLION DOLLARS! – WHILE PEOPLE STARVE IN USA. DOLLAR SIGNS, NOT LIVES. READ BELOW AND YOU WILL SEE ALSO OTHER WAYS WE HAVE OUR MONEY SUCKED OUT FROM UNDER US. ONE OF THEM IS THE ENERGY SYSTEMS, WATER HYDRO ETC. WHICH IS ALWAYS HIDDEN INCOME. HOW MUCH DO YOU WANT TO BET OUR TAXES ENDED UP FUNDING THIS AS WELL. KEEP IN MIND, THAT THE SCIENTISTS ONLY CONSIDER MONEY AND NOT THE LOSS OF HUMAN LIFE AS MILLIONS STARVE TO DEATH EVERY FEW YEARS. THIS IS THEIR JUSTIFICATION FOR KILLING AND NOT CARING AS THE REPTILIANS WERE INTERESTED IN COMPLETE CONTROL OF ALL OF HUMANITY AND KEEPING US ENSLAVED. ALSO – THEY NEVER, EVER REALLY TELL YOU THE EXACT FIGURES WITHER. THEY USUALLY HAVE ALL THE BANKSTERS TO BACK THEM ALL UP AS WELL AS THEY ARE 100 % REPTILIANS, GO FIGURE! LOOK HOW THEY EXPLAIN SPENDING AS JUSTIFICATION OF SCIENCE – NOT LIVES. DO THEY TELL YOU BILL GATES AND THE BANKSTERS OWN THE DISEASES AND THE CURES, OF COURSE NOT. BUT LET’S KEEP SCREWING EVERYONE OVER BY STEALING FROM – ILLUMINATI CANCER RESEARCH CHARITIES ETC. NASTY! NOTICE OF COURSE MULTI – DONATIONS FROM THE WORLD’S WEALTHIEST INDIVIDUALS WHO STOLE OF OF HUMANITIES MONEY FROM BANKING, LOANS AND TAXES INSURANCES ETC. ARE THE 100 % REPTILIANS BANKERS AND SOME MAJOR POLITICIANS AND MOST CERTAINLY MANY ARMY & SPACE GENERALS! BUT THEY STILL LIE TO PEOPLE TO COLLECT MONEY FROM CHARITIES! COMBINED WITH SUCKED OUT BY THE VATICAN AND OUR GOVERNMENTS WHOM PEOPLE THOUGHT WERE THE GOOD GUYS UNTIL THEY WOKE UP. SPENDING TRILLIONS ON REPTILIAN RESEARCH SO THEY CAN SEE WHICH PLANET THEY WOULD TAKE-OVER NEXT!
******************************************************************************
http://scienceogram.org/in-depth/health/
Health
Cancer kills almost a third of us, and yet we spend less than £5 per person per year researching it. (And it’s arguably the best-funded medical condition.)
Looking at other big killers paints a stark picture of the state of UK medical research funding. Let’s look at government spending on diseases, compared to the number of people killed by them.

Heart disease is responsible for around 15% of deaths, and yet we spend just £1.30 per person per year researching it. Stroke is the third most deadly individual condition, responsible for 10% of deaths; stroke research receives just 28 pence per person per year. So, astonishingly, these three conditions are responsible for over half of the deaths in the UK, and yet we invest less than £6 per person per year to try to understand their causes and find new treatments.
Medical research is a special case in science, because charities make a significant contribution—in fact, over half of UK medical research into cancer, heart disease and stroke is charity-funded. The combined figure for public and non-profit research into these three conditions is around £12.50 per person per year, which still seems feeble compared to their deadliness.
Looking at mortality statistics starts to give a sense of scale to measure up health research spending, but what doesn’t kill you can nonetheless have a huge effect on your quality of life. Therefore, it would be a mistake to concentrate all our research on the most fatal conditions. For example, dementia has a massive effect on quality of life, but the condition itself is rarely fatal. It affects one in six people over 80; we spend about 60p per person per year researching it.
The suffering caused by illness should be reason enough to invest more seriously in looking for treatments. However, diseases also come with a significant economic cost. Firstly, there’s the substantial direct cost, in terms of health and social care for sufferers. Secondly, there are large indirect costs, such as friends and family members taking time off work to care for loved ones. The total economic impact of the four diseases mentioned is over £800 per UK citizen (split between everyone, not just patients) per year. This makes the combined £6.50 (£13 with charities) each we spend researching all four of these conditions look rather paltry.

The total investment in health research also looks tiny compared to overall government spend on healthcare; government, EU and charity research investment comes to less than £60 per person per year, whereas UK healthcare spend is around £1,900—and that’s before we take into account any of the other economic or human costs of ill health. If we want to reduce these costs and improve our health, we should increase the sum devoted to research.
Ageing
It’s not only research into individual diseases that is important, however. Cancer, heart disease, stroke and dementia, along with many other conditions from diabetes to macular degeneration, are all known as ‘age-related diseases’: they disproportionately afflict older people. In fact, more than 85% of deaths in the UK occur due to such conditions.

It’s well-known that the elderly are at greater risk of death and disease, but by just how much is quite surprising. For example, between the ages of 25 and 34, you’ve got a 1 in 1700 chance of dying annually (in large part due to accidents and self-harm). However, between the ages of 75 and 84, the annual risk of death has gone up nearly 100-fold. In fact, the risk of dying in a given year increases exponentially as you get older: it roughly doubles every seven to eight years. This massive increase in risk is due largely to the increased burden of age-related diseases.

Your increased susceptibility to these diseases arises from the process of ageing. Biologically speaking, ageing comprises an accumulation of a variety of molecular and cellular junk in our bodies, and the effects of this junk are what make these diseases so common in the elderly.
Finding ways to slow the accumulation of age-related damage, or fix it once it has accumulated, could provide broad-spectrum protection against a range of age-related conditions, and significantly improve the health and happiness of our ageing population. This is a serious possibility: we’ve been doing it successfully in lab animals for decades. Unfortunately, research in this area is hampered by an equally serious lack of investment: we spend around 40p per person per year investigating the ageing process. If we want to unlock the huge potential benefits of ageing research, we must increase this investment.
From ageing, to energy: the next section looks at the economic and environmental consequences of our tiny investment in energy research.
******************************************************************************
Big science
Spending billions on big scientific goals might sound costly, but we routinely spend much larger sums on everything from wars to sporting events.
It’s quite common to think of scientific breakthroughs as a number of years away: fusion will be powering homes in 50 years, we might have cured cancer by the end of the century, and so on. However, scientific discoveries can only be made if you try: no amount of hours spent not looking for a cure for cancer will find one. It makes more sense to think of us being a number of person-hours, or even a certain investment, away from the next giant leap.
It’s therefore worth stepping back from the pounds per person per year framework for a moment to consider the total amounts required to solve some of the big problems in science. To provide a sense of scale, they can be compared to the price tag of other large national and international projects.

- The iPhone is a phenomenally successful piece of technology, grossing over £120 billion since it was launched in 2007. It’s very probable that we could have developed fusion with that much money (it’s more than double the estimated cost of doing so).
- The world’s 100 wealthiest people could join forces to add a few years to global life expectancy, develop fusion and send people to the Moon, and still have change for a mansion or six.
- The UK bank bailout, at its height in 2009, saw the government underwriting the banks to the tune of nearly one trillion pounds: half as much again as the amount of public money spent on health research, worldwide from 1981–2010.
We’re not calling for iPhone owners to donate their next upgrade or for a League of Billionaire Science Philanthropists here (though those things could be cool); these comparisons are intended to illustrate how small science spending seems in the context of our global finances.
Making these numbers fit the Scienceogram methodology of pounds per person per year can be tough, because many of the projects above were done by (and for) different numbers of people. However, acquiring knowledge is an international collaborative endeavour; to some extent, it doesn’t matter where a particular piece of research is done. If you take a look at the scientific projects with this in mind, big discoveries look tantalisingly close.

A simple approximation is to divide these figures by the population of the ‘high-income countries’, some 1.1 billion people. As discussed on the Energy page, developing fusion power will probably set us back around £60 billion—which is just £50 each.
The problem with predictions
All predictions about future scientific discoveries are terribly unreliable. It’s even hard to generalise: we might expect future discoveries to be more expensive than past ones because we’ve already found all the easy stuff; but then, our advanced tools, techniques and accrued knowledge allow us to probe reality faster and more wisely than we have in the past, which could end up making discovery cheaper.
Though it makes sense to plan and draw a roadmap to cracking fusion, we can’t be sure that we’ll have an affordable power source at the end of it. Equally, it’s hard to extrapolate the cost of future medical breakthroughs by looking at how much it cost in the past. However, even if scientific discovery does turn out to be several times more expensive in the future than it has been thus far, it’s still pretty cheap compared to other collaborative international endeavours—and the payoff from a small investment is potentially enormous.
This gives us an impression of what’s going on globally: how do individual countries stack up? We investigate this in the International comparisons section.
International comparisons
Looking at science spending internationally shows that the UK could certainly invest more in research without compromising our economic wellbeing.
Viewed globally, the UK government’s investment in science per capita seems unremarkable; we’re 18th in the world. Clearly, it’s possible for a government to invest a lot more in science than we do here in the UK.

The top public spender on science is Norway, which invests over twice as much as we do per capita, and we are significantly out-spent by governments from Germany to the US. In fact, looking at international averages, the UK public expenditure on R&D of £134 per person per year puts us below the average for the G8 (£187), the OECD (£160) and the twenty-seven countries of the EU (£142).
Another way to look at these figures is to consider research expenditure as a percentage of GDP. Once again, the UK comes in below the average for major groups of nations.

As these two graphics demonstrate, other countries devote much more money to research than the UK does. This suggests that spending more on science isn’t likely to stunt economic growth and, whilst correlation obviously doesn’t imply causation, it’s also possible that science and the side-effects of science spending may have played a part in their success.
There is a sense in which international comparisons aren’t very interesting, though: most countries have chosen their science budgets in a similar way to the UK, via a complex chronology of political compromise, rather than by taking a step back and performing a comparison of costs and benefits. Also, while focusing on how different countries measure up relative to one another, it’s easy to lose sight of how small these figures are in absolute terms: there are only four countries whose governments spend more than 1% of GDP on research.
